Application Deployment Guide
This guide walks you through creating, configuring, deploying, and monitoring an application in the Siemens Healthineers Frontier Developer Portal.
Each step follows the same structure:
- Purpose – Why this step matters
- Prerequisites – What you need before starting
- Actions – Step-by-step instructions
- Result – What happens after completion
- Impact on later steps – Dependencies and downstream effects
- Screenshot + Caption – Action-focused visual reference
📋 Deployment Steps
- Create a new application
- Configure general settings
- Define data selection rules
- Upload the processing unit
- Add UI, JSON schema, and viewer layout
- Deploy and monitor the application
- Run your first case
- Monitor logs & metrics
- Troubleshooting & Best Practices
Before You Begin
Purpose
Ensure all assets, credentials, and decisions are in place before you start.
Prerequisites
- Frontier Developer Portal access with app creation permissions (teamplay Institution + Frontier Developer Portal license + User role "Frontier Developer Portal" assigned).
- A prepared ZIP package (Windows) or Docker image (Linux).
- Terms & Conditions and User Manuals (PDF format).
- An application icon (round, 82px x 82px, png)
- Knowledge of resource requirements (CPU, RAM, GPU) and mount paths.
- For container-based apps: ability to use Docker to push images.
Actions
- Gather all required artifacts into a single project folder (zip) or a Linux Docker Container.
- Confirm you have environment access (Cloud or On-Prem).
Result You can complete the workflow without needing to pause for missing files or decisions.
Impact on later steps Missing documents or unclear requirements will block deployment or cause configuration rework.
Confirm the application type (Research vs. Commercial) before starting.
Application is released for clinical use, which is not intended for clinical use.
Functionality, which is not developed with the necessary quality, is applied for clinical use.
Be very careful, when you want to create an application of application type "commercial", which is intended for clinical use: Be aware that you and/or your organization need to develop such application with necessary care, following all necessary steps demanded by standards and laws. Provide an about box with all needed information and be ready to deal with complaints from users. Select application type "Commercial" only, if you are sure to have done all needed actions.
Screenshot + Caption
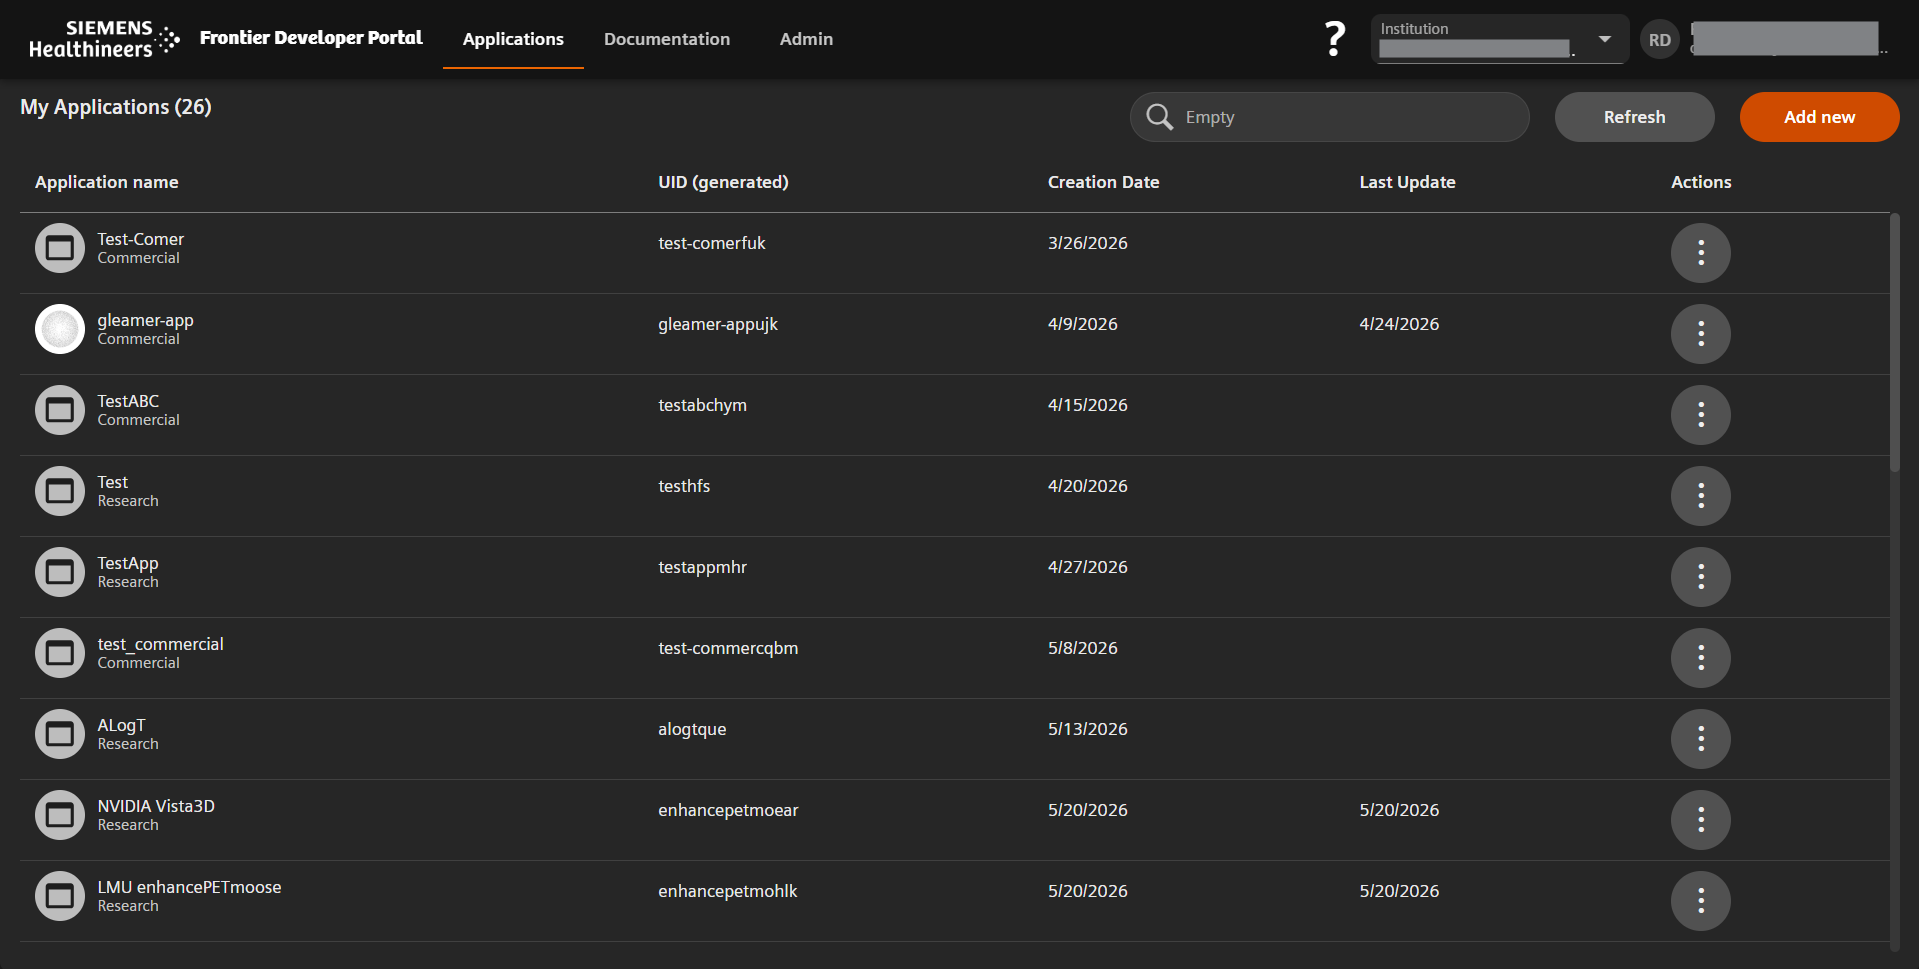
Applications overview showing existing entries and metadata.
Login & License Entitlement Check
Purpose
Understand what the portal validates when you log in, and what to do when your institution is not entitled to use the Frontier Developer Portal.
Prerequisites
- A valid teamplay account.
- Your active teamplay institution must have:
- a valid Frontier Developer Portal license, and
- the user role "Frontier Developer Portal" assigned to your user.
Actions
- Log in to the Frontier Developer Portal with your teamplay credentials.
- On login, the portal automatically validates your active teamplay institution:
- that you are still a member of the institution,
- that the institution holds a valid Frontier Developer Portal license, and
- that the institution is entitled to use the Frontier Developer Portal.
- If the check passes, you are taken to the Applications overview.
- If the check fails, a Welcome dialog appears with the message:
"Looks like your institution's license (<institution name>) is expired or you are no longer part of it." From this dialog you can:- Choose another teamplay institution from the dropdown and click Update to switch to an entitled institution, or
- Log Out.
Result You either enter the portal with an entitled institution, or you are kept on the Welcome dialog until you select an institution that has a valid license and permission.
Impact on later steps Without an entitled institution you cannot access Applications or perform any deployment steps. All later steps assume a successful login with an entitled institution.
The same entitlement check runs when you switch institutions using the institution picker in the top navigation. If you select an institution without a valid license or permission, the switch is rejected, the same Welcome dialog is shown for the institution you attempted to select, and you remain on your current institution.
If the dialog shows "Sorry - you don't have any teamplay institutions." or none of your institutions are entitled, contact your teamplay administrator to have the Frontier Developer Portal license and the "Frontier Developer Portal" user role assigned to your institution and user.
Screenshot + Caption
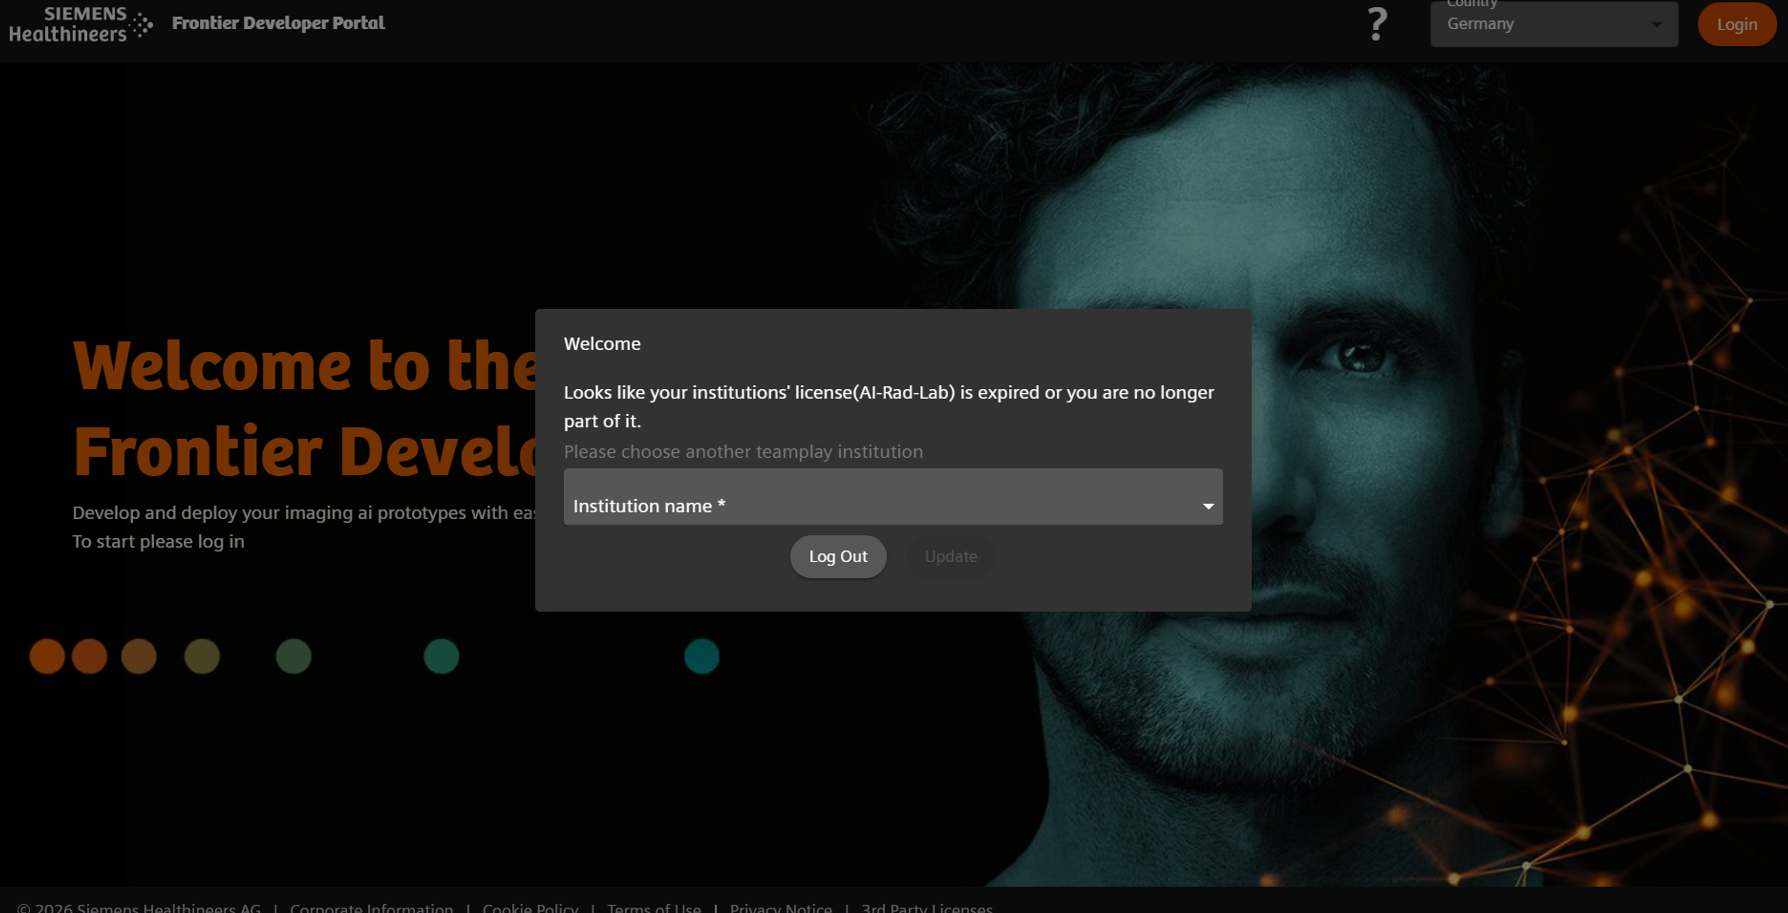
Welcome dialog shown when your institution is not entitled to use the Frontier Developer Portal — choose another teamplay institution and click Update, or Log Out.
Open the Applications Overview
Purpose
Access the dashboard where all applications are listed and managed.
Prerequisites
- Valid login to the Frontier Developer Portal.
Actions
- In the top navigation, click Applications.
- Review the columns:
- Name, Unique ID, Created Date, Last Update, Type (Research or Commercial).
- Open an existing application for editing
Result You see all applications you have permission to manage and which you can open for editing.
Impact on later steps This is your entry point for creating, configuring, and monitoring apps.
Screenshot + Caption
Click Applications to see all app entries and their metadata.
Create a New Application
Purpose
Register a new application entry to begin configuration.
Prerequisites
- Decision on application type:
- Research – Not for clinical use; may use generic research T&Cs.
- Commercial – Clinical; requires validated documentation.
- Commercial - Clinical; requires a dedicated activation by the Partner Manager
- Decision on processing unit type:
- Interactive - For Windows-based apps with ZIP package and have their own GUI.
- Non-Interactive - For Windows-based apps with ZIP package without GUI or Linux-based apps with Docker container.
Actions
- In Applications, click Add new (top right).
- Enter the Application Name.
- Select the Application Type.
- Click Create.
Result A new application entry is added and you are redirected to its configuration tabs.
Impact on later steps
- Application type determines required legal documentation, e.g. About Box
- Results created by research apps will get automatically the "Not for clinical use" banner, suffix to the image comment and series description and additionally the caution will be burned in generated DICOM images.
Screenshot + Caption

Enter name, choose type, and click Create to start configuration.
Configure General Settings
Purpose
Set deployment targets, runtime limits, and upload mandatory documentation.
Prerequisites
- Application entry created.
- Terms & Conditions, icon and manuals ready (for Commercial apps).
- CPU, RAM, and runtime requirements defined.
Actions
- Open the General tab in the left menu.
- Under Deployment Options, choose:
- Cloud (AI Rad Companion)
- On Premise (syngo.via, Syngo Carbon)
- Under Application Type, choose:
- Interactive (Windows ZIP with GUI)
- Non-Interactive (Windows ZIP without GUI or Linux Container)
- In Runtime Properties, configure:
- Max Memory (GB)
- Max CPU Cores
- Application Timeout (seconds)
- Multiplier (supported for OpenApps Deployment only)
- Offset (supported for OpenApps Deployment only)
- Configure Prior Study Support if needed (supported for OpenApps Deployment only)
- Upload:
- Application Icon (optional)
- Terms & Conditions (required for deployment)
- Manuals (required for Commercial)
- Application Configurations (optional)
- Drag & drop files or folders (structure is preserved during deployment)
- Supported formats: Files without any extension or files with any of the following extensions ".json, .yaml, .yml, .xml, .config, .env, .txt, .lic"
- Max 10MB per file
- Sample Data (optional, supported for OpenApps Deployment only)
- Drag & drop DICOM files or folders with DICOM study subfolders
Result The app’s general configuration is saved; legal requirements are met. Application config files are accessible via the configuration directory at runtime.
Impact on later steps
- Missing T&Cs will block deployment in the Deploy wizard.
- Runtime limits are enforced at execution.
Use realistic timeout values — too short may cause unnecessary failures, too long can block resources.
Screenshot + Caption
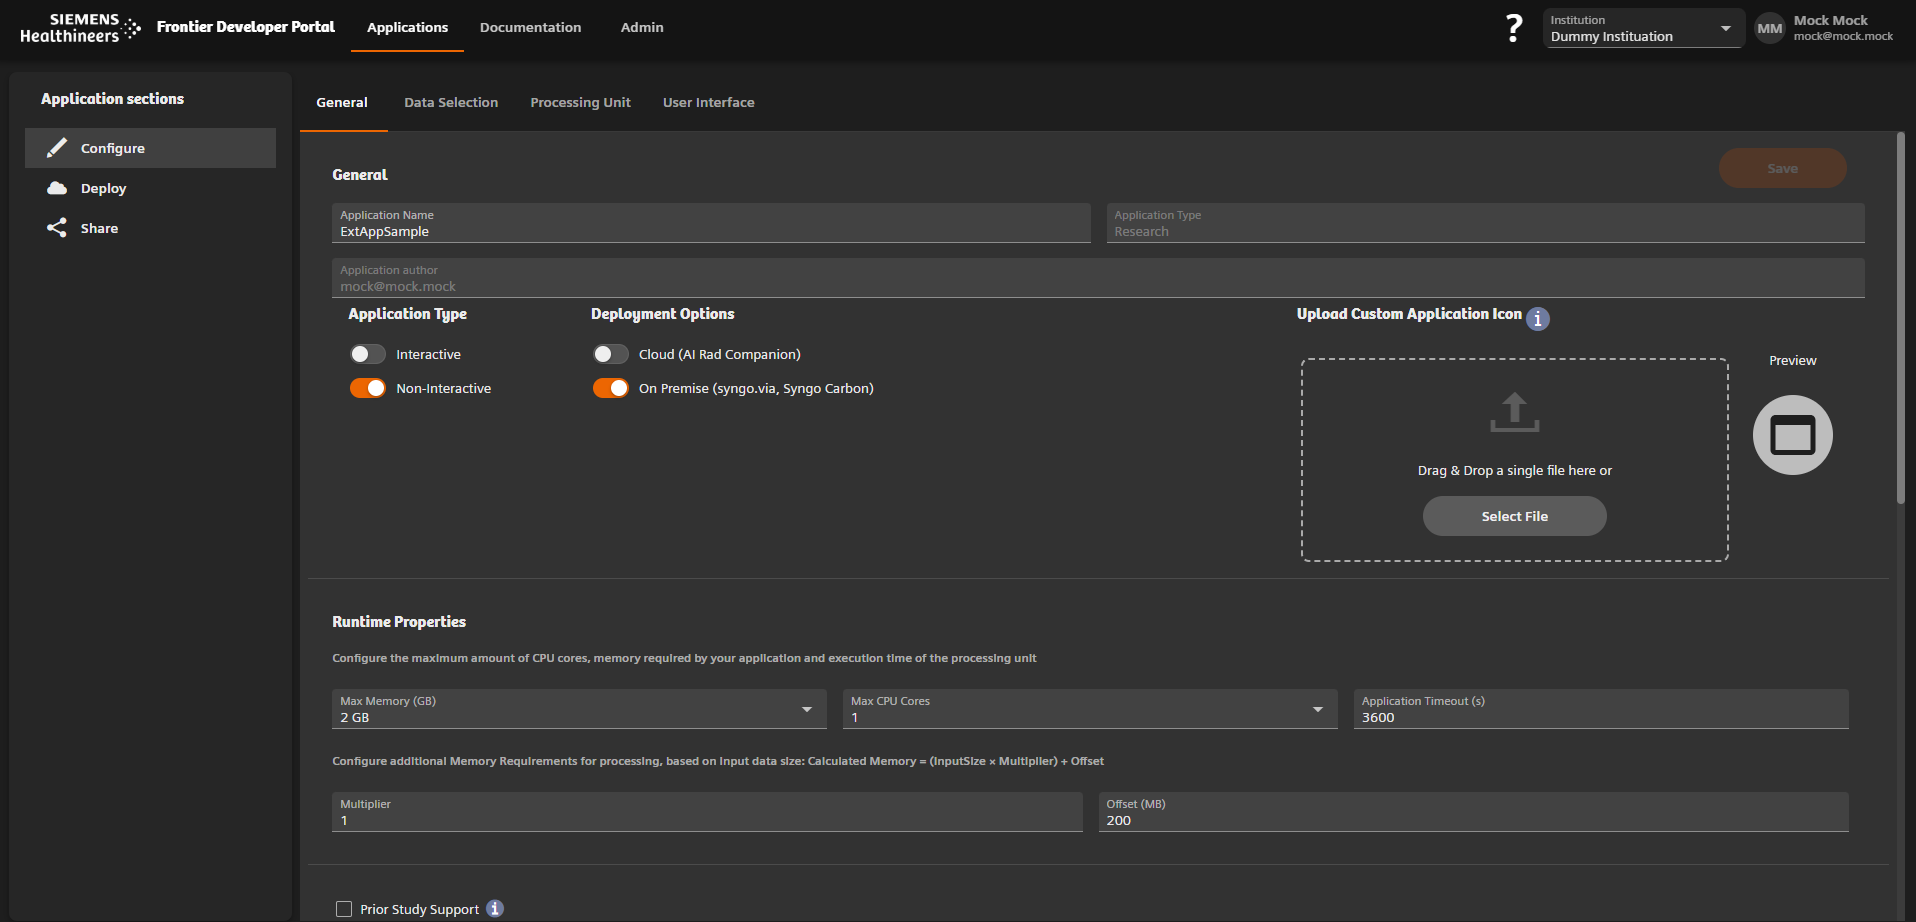
Select deployment targets and configure runtime limits.
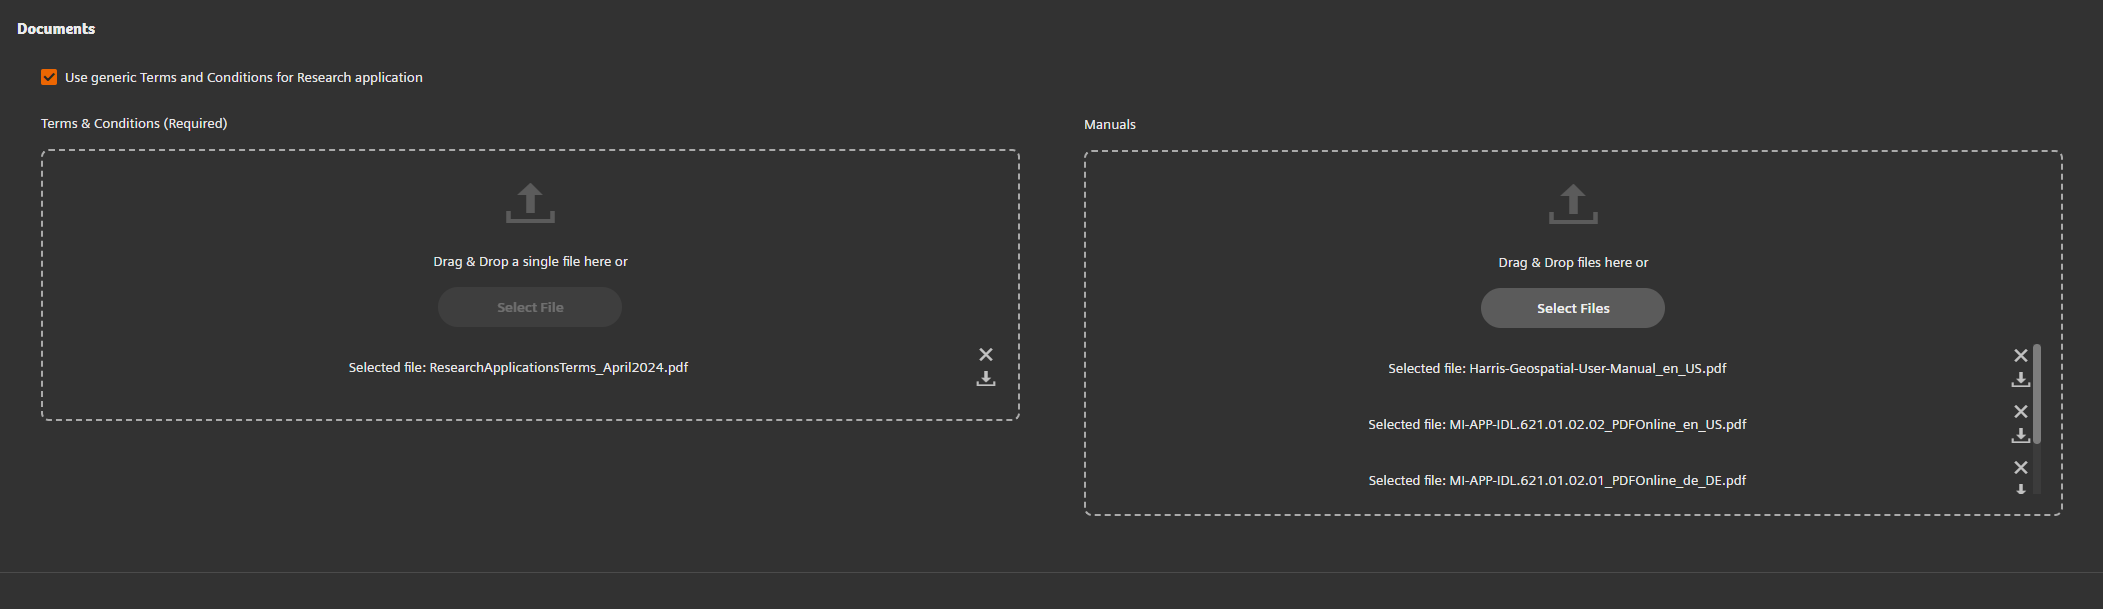
Upload Terms & Conditions and manuals.
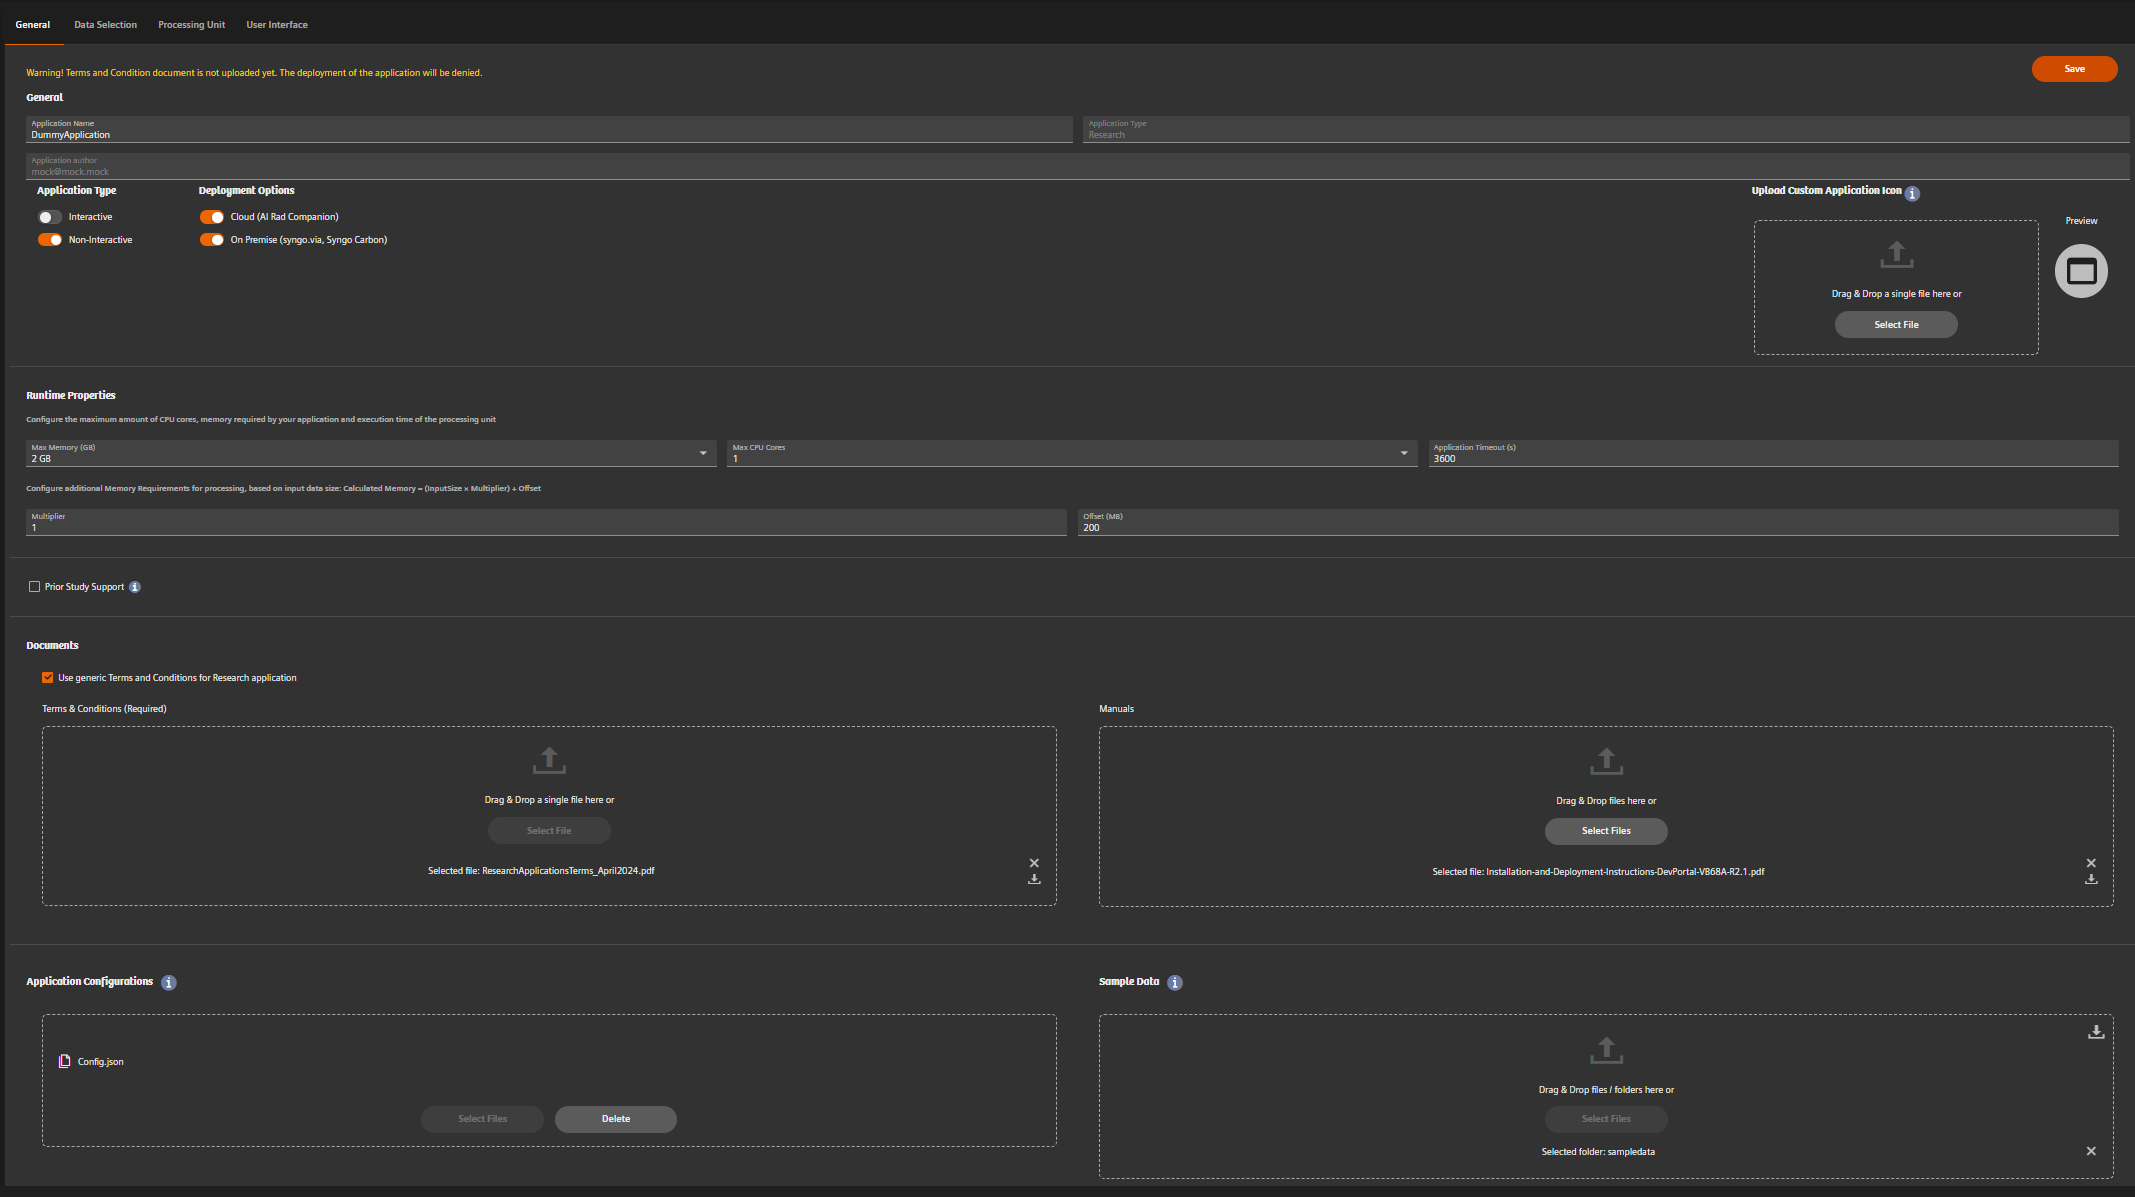
Example: completed General tab with all required fields.
Define Data Selection Rules
Purpose
Specify which DICOM studies or series are routed to your app.
Prerequisites
- Knowledge of supported SOP Class UIDs.
- Criteria for selecting the right series (description, instance count, etc.).
Actions
- Open Data Selection Rules in the left menu.
- Set Supported SOP Class UIDs.
- Configure Series Selector:
- Match on series description, instance count, or latest series.
- (Optional) Add a Study Selector for additional filtering.
Result Only matching studies/series are sent to your application.
Impact on later steps
- Too strict → No data for testing.
- Too loose → Unintended data routed.
[!NOTE]
Start with broad filters for initial testing, then tighten them for production.
Screenshot + Caption
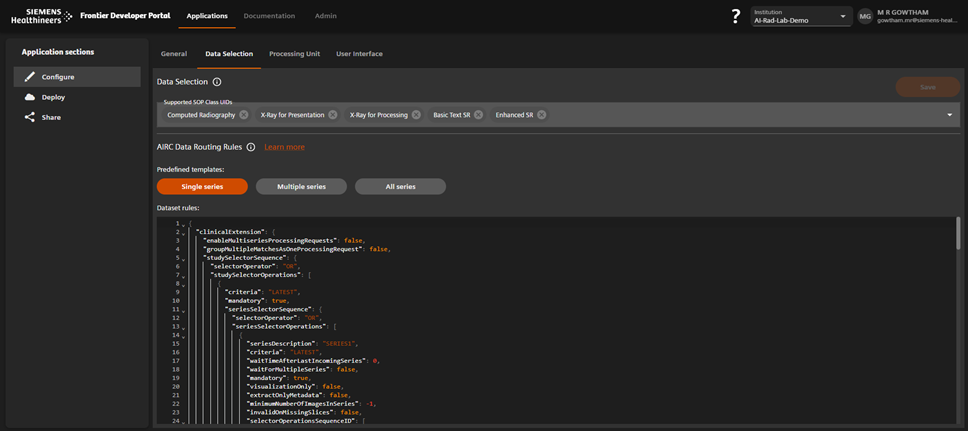
Define SOP Class UIDs and filter criteria to control data flow.
Upload the Processing Unit
Purpose
Provide the runtime component (ZIP for Windows or Docker image for Linux) that executes your app.
Prerequisites
- Built ZIP or container image.
- For containers: Docker client installed and able to push images.
Upload a ZIP Package (Windows)
Actions
- Choose ZipFile as upload type.
- Select the
.zipfile. - Choose the executable inside the ZIP.
- Set arguments using tokens, e.g.:
-inputDir {InputDirectory} \
-resultDir {ResultDirectory} \
-configDir {ConfigDirectory} \
-workingDir {SuspendDirectory} \
-logDir {LogDirectory} - For Interactive Applications set the Launch Executable, Window Title, Launch Timeout, GPU settings and PreProcessing settings as needed.
- Click Save.
Result
- Windows-based processing unit is registered.
Impact on later steps
- Paths must be resolved from tokens at runtime.
Screenshot + Caption
Upload a Container Image (Linux)
Actions
- Set arguments using tokens and absolute folder paths, e.g.:
-/mnt/input
-/mnt/output
-/mnt/config
-/mnt/log - Choose ContainerImage as upload type.
- Get the temporary registry credentials from the portal.
- Push your image:
docker tag myimage:latest <registry>/<image-tag>
docker login <registry> -u <username> -p <token>
docker push <registry>/<image-tag>
Result
- Linux container image is uploaded and linked to your app.
Impact on later steps
- none
Screenshot + Caption
Add UI, JSON Schema, and Viewer Layout
Purpose
Define the application’s Configuration UI and Confirmation UI.
Prerequisites
- JSON schema for Configuration UI.
- Optional: Confirmation UI viewer layout definition for result visualization.
Actions
- Open the UI Configuration tab.
- Upload the JSON Schema describing input parameters.
- Test the UI:
- Preview fields and default values.
- Ensure alignment with your processing unit’s argument parser.
- (Optional) Configure a Viewer Layout for DICOM result visualization.
Result End users can configure the application before execution; results are displayed with intended layout.
Impact on later steps
- Incorrect schema will prevent the UI from loading.
- Missing layout will fall back to default viewer behavior.
JSON schema must match your application’s expected parameters exactly — mismatches cause runtime errors.
Screenshot + Caption
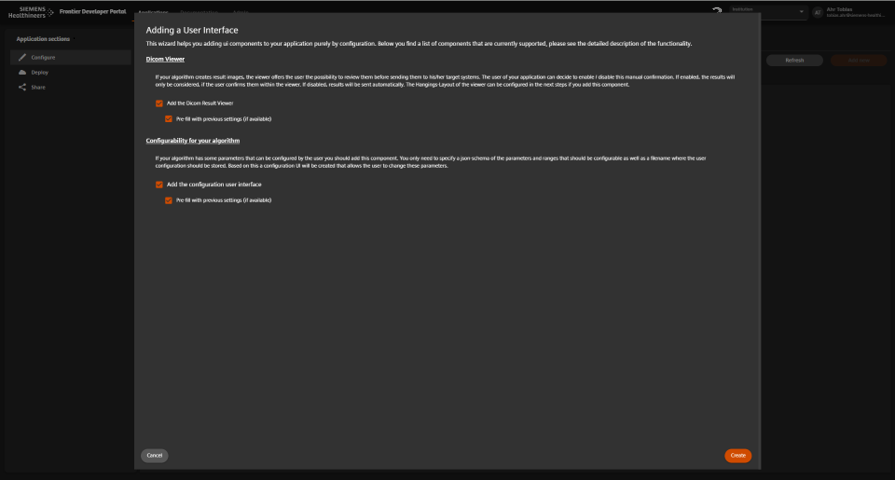
Upload JSON schema and optional viewer layout.
Deploy and Monitor the Application
Purpose
Make the application available for execution in the selected environment and track usage.
Prerequisites
- All configuration steps (1–6) completed.
- Required documents (T&Cs, manuals) uploaded.
Actions
- Open the Deploy tab.
- Create a new deployment
- Select suitable application configuration, processing unit, UI and provide additional metadata
- Click Deploy.
Result Application is live and can process data according to its configuration.
Impact on later steps
- Application can now be tested
Only deployed applications are visible to users of your institution only.
Screenshot + Caption

Deploy the application and monitor execution metrics.
Run your first case
Purpose
Verify that the deployed application processes a real DICOM case end-to-end.
Prerequisites
- Application successfully deployed to the target environment (Step 7 completed).
- Access to teamplay DICOM Hub or relevant DICOM sending system.
- Example DICOM file available for upload.
Actions
- Open teamplay DICOM Hub.
- Upload an example DICOM image and select your deployed application (e.g., AIRCResearch lab32 WEU) as the target application during upload.
- Verify the uploaded study appears in All Studies.
- Send the study to your deployed application.
- Monitor the Queued list until the case moves to Completed.
- Check the results in teamplay DICOM Hub.
Result
- The case is processed, and the result is returned to the sending system (e.g., rotated image, AI result, etc.).
Impact on later steps
- Confirms that the deployment is functional before wider release.
- Identifies any configuration or connectivity issues early.
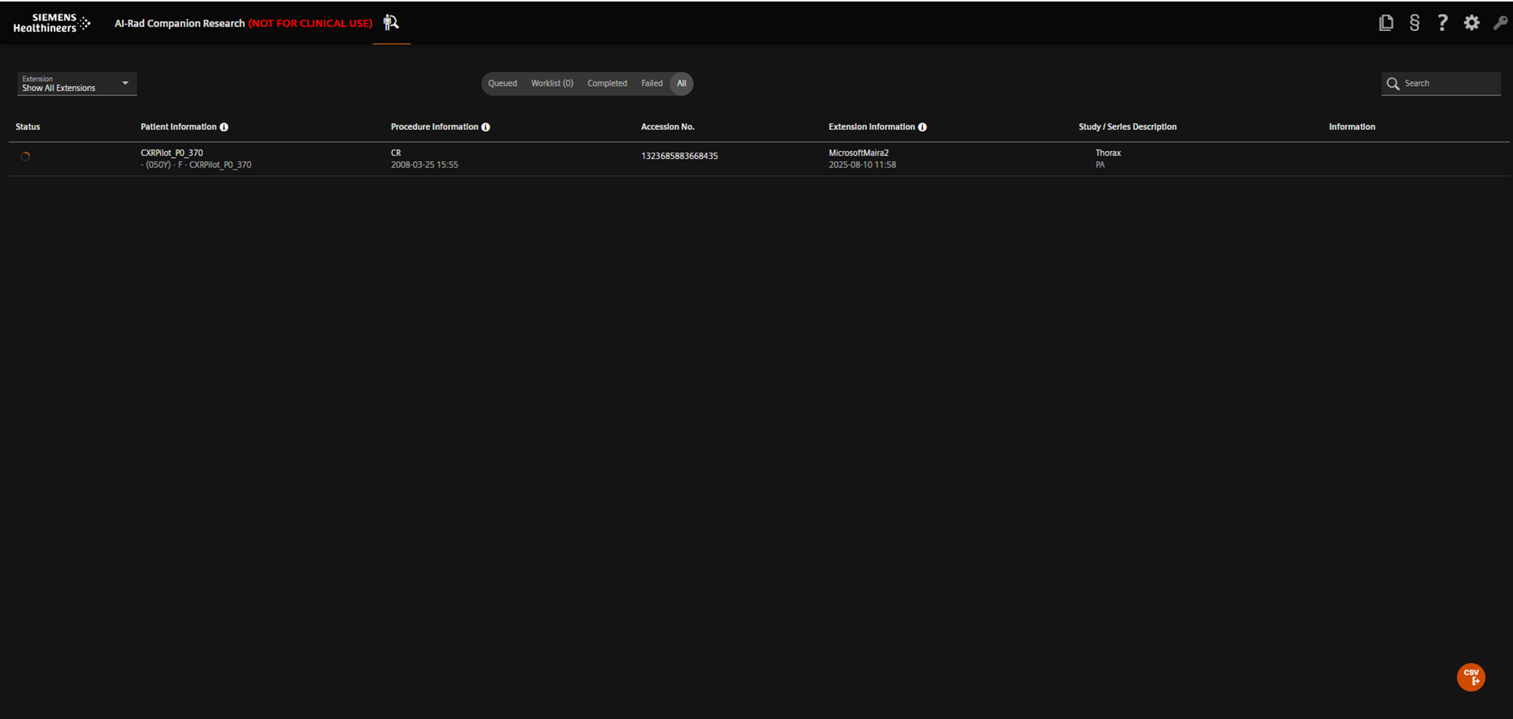
Screenshot + Caption
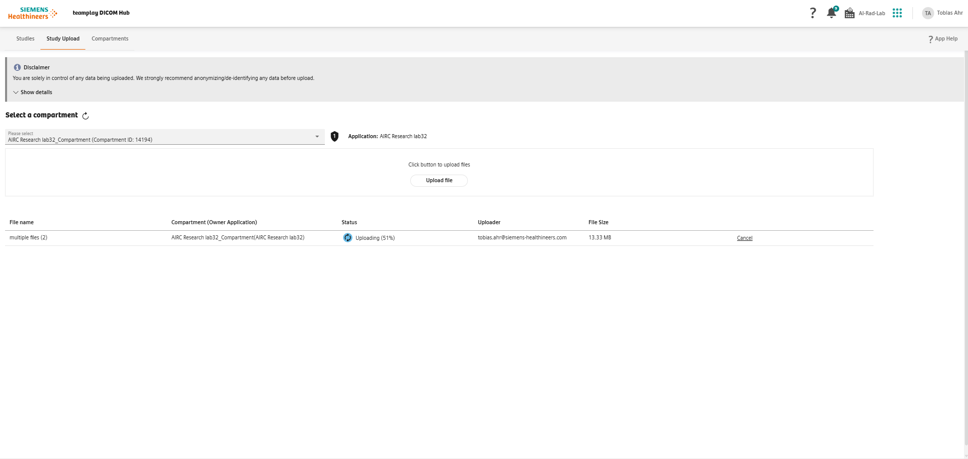
Upload the example DICOM image to teamplay DICOM Hub.
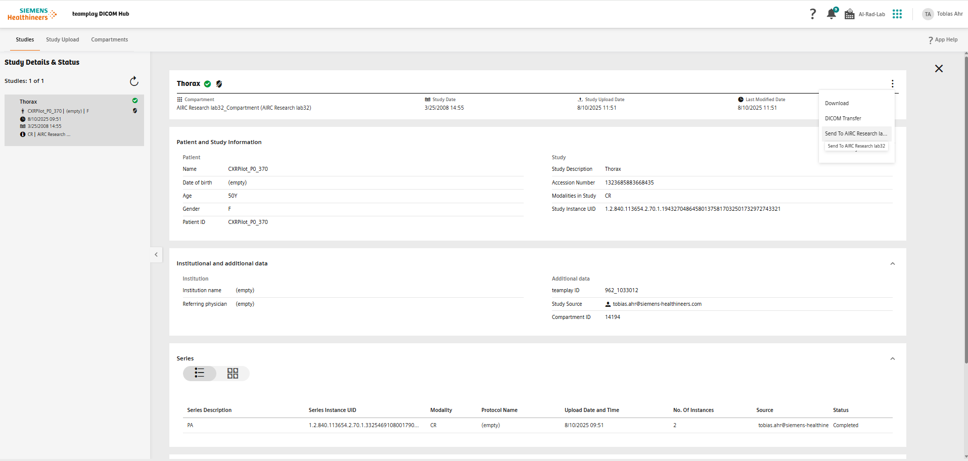
Send the uploaded study to your deployed application.
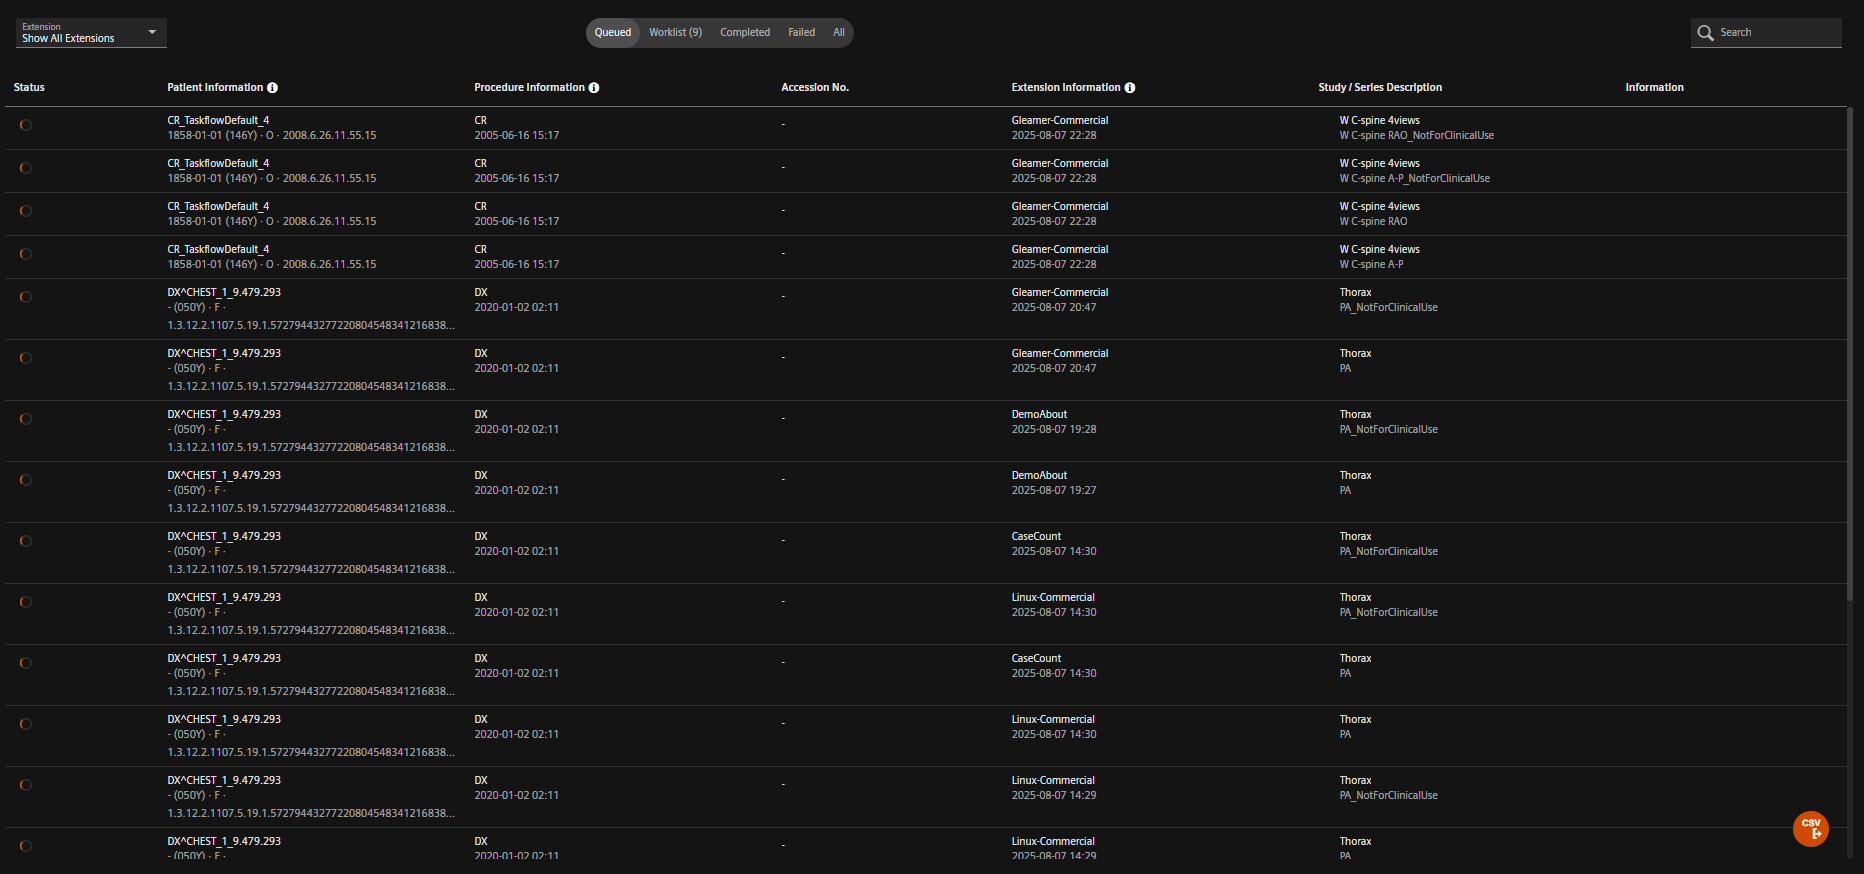
Case in queue awaiting processing.
Processing completed successfully.
Results available in teamplay DICOM Hub.
Monitor Logs & Metrics
Purpose
Access application logs and performance metrics to verify correct execution and troubleshoot issues.
Prerequisites
- At least one completed case processed by the application (Step 9 completed).
- Appropriate permissions in the Developer Portal to view logs.
Actions
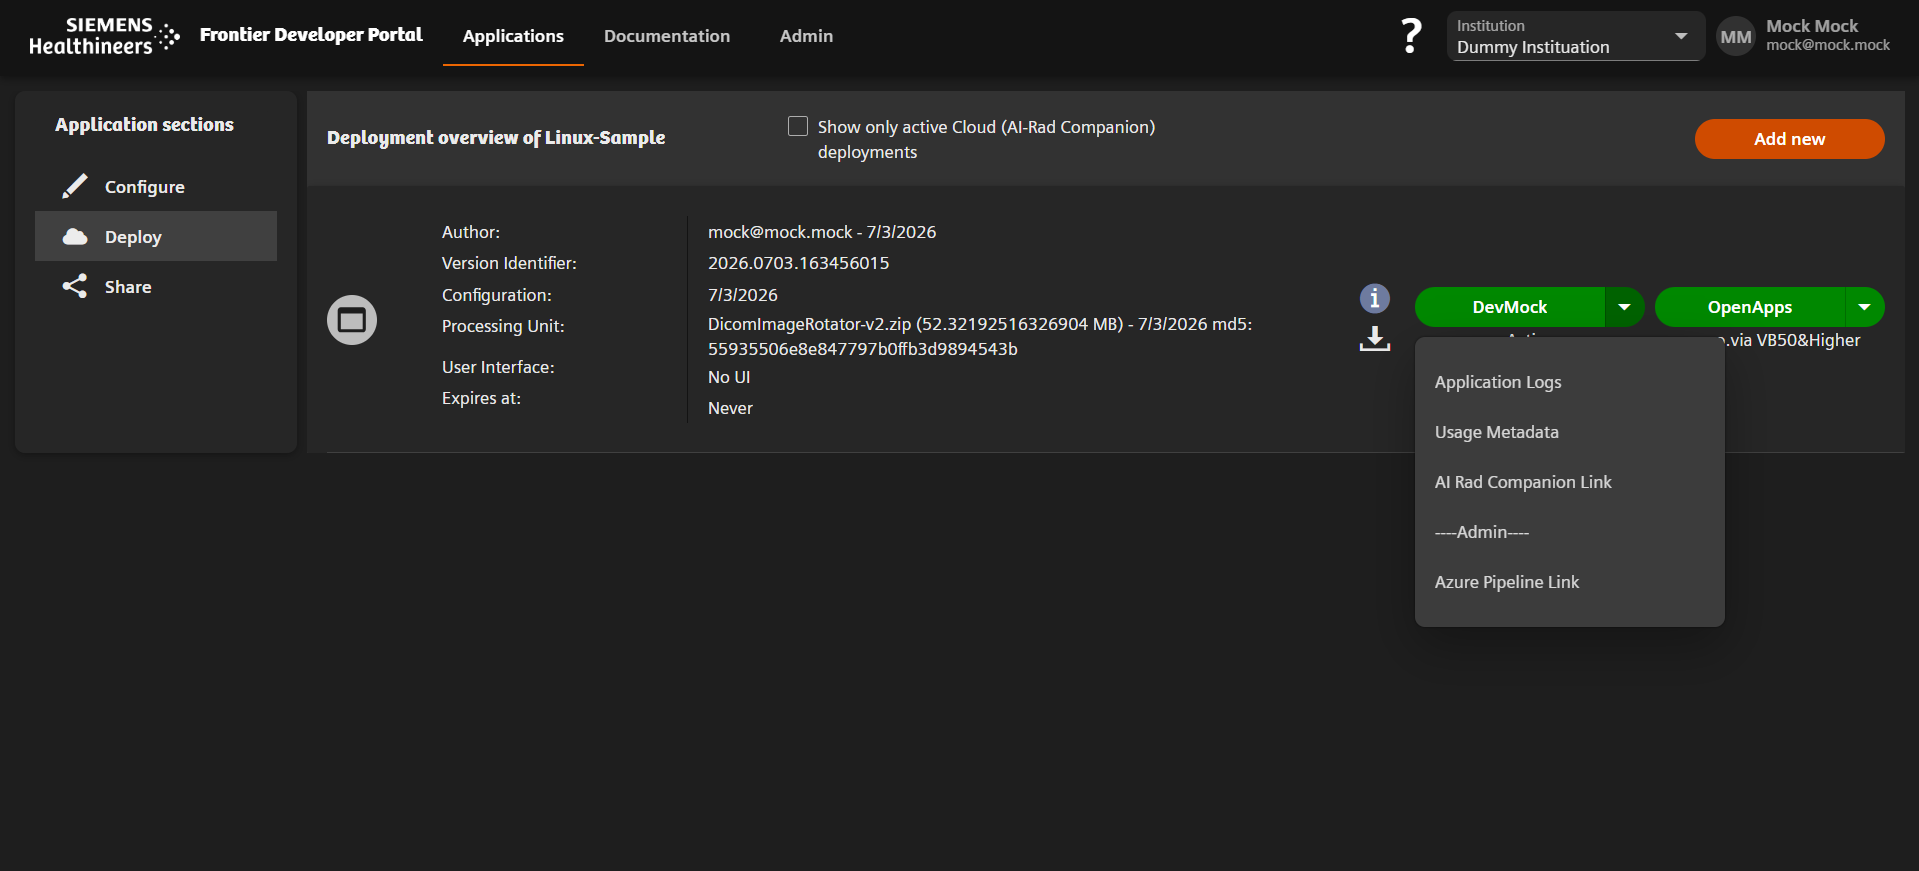
- In the Developer Portal, go to the Deployments tab for your application.
- Locate the deployment entry for your target environment.
- Click the deployment’s action button and select Application Logs.
- Review logs for errors, warnings, or unexpected behavior.
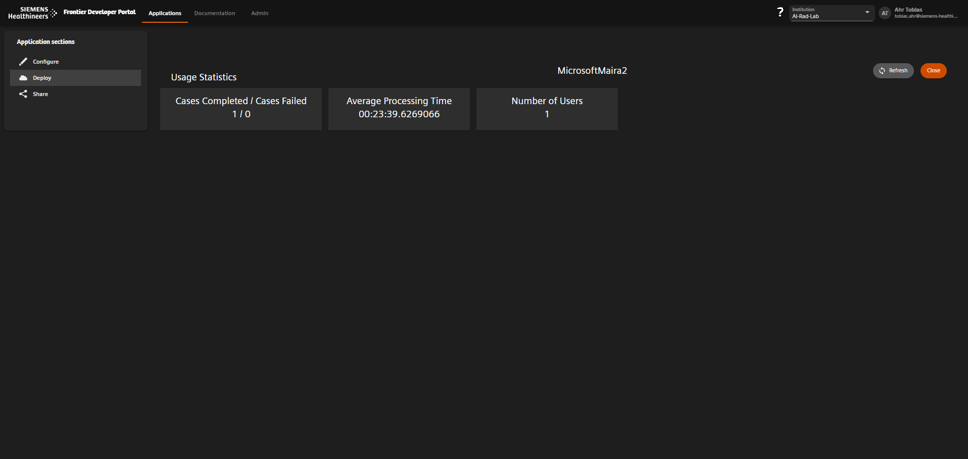
- Use the Monitoring section to view execution counts, success/failure rates, and performance metrics.
Result
- Logs confirm whether the application ran as expected.
- Performance metrics provide insights into runtime behavior.
Impact on later steps
- Early detection of issues allows for faster resolution.
- Metrics support performance optimization and scaling decisions.
For Open Apps deployments, logs must be retrieved directly from the system or via SRS. Developer Portal logging is currently only available for AIRC Research cloud deployments.
Screenshot + Caption
Open the application logs for a specific deployment.
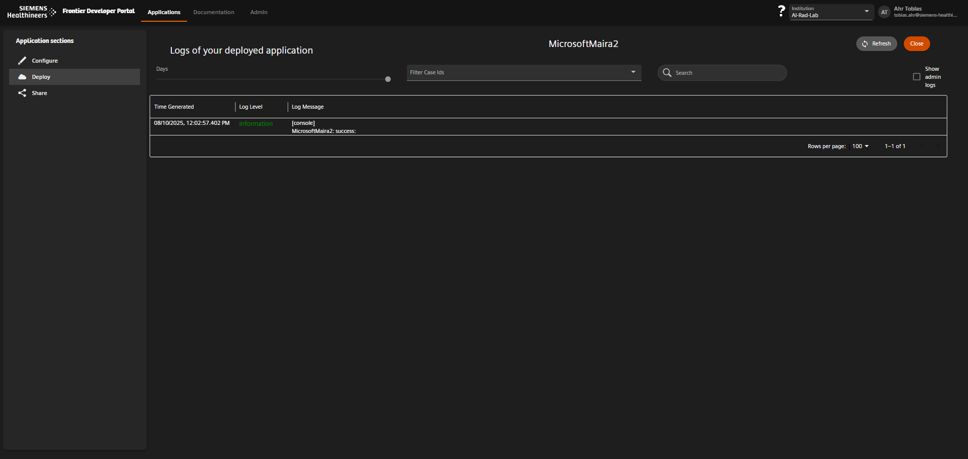
Detailed application logs for troubleshooting.
Troubleshooting & Best Practices
Common Issues
Application not receiving data
Cause: Data selection rules too strict.
Fix: Loosen SOP Class UID or description filters in Step 4.
Mount path errors
Cause: Token mismatch or incorrect container path.
Fix: Verify mount paths in Step 6 match your application’s CLI arguments.
Deployment blocked
Cause: Missing Terms & Conditions or manuals.
Fix: Upload required documents in Step 3.
Best Practices
-
Consistent Mount Paths
Always use/mnt/input,/mnt/result,/mnt/logfor predictable behavior. -
Version Control
Tag your container images with semantic versions (1.0.0) to track changes. -
Test Broad, Deploy Narrow
Start with wide data selection rules for testing; narrow them for production. -
Document Runtime Limits
Record CPU, RAM, and timeout values in your project documentation. -
Use Monitoring Proactively
Review execution logs weekly to catch issues early.
Store all JSON schemas, viewer layouts, and mount path configs in the same Git repository as your processing unit for easier change tracking.
Screenshot + Caption
Use monitoring to track executions and debug failures.